

The coronavirus pandemic caused an unprecedented economic shock in the UK, closing businesses and putting people out of work left, right and centre. But despite that, average house prices held up across England – even if there was a drop in sales. It was the same picture in Luton, where prices rose by 3.7 per cent in the year to September 2020. Across the East of England, prices rose by 2.2 per cent. The ONS also publishes house price figures by Middle Layer Super Output Areas (MSOAs) – small geographic areas containing an average of 7,200 people. These show 15 of the 21 MSOAs that make up Luton saw a rise in house prices over the same period. Here we reveal which neighbourhoods saw the strongest growth in the year to September 2020.
5.
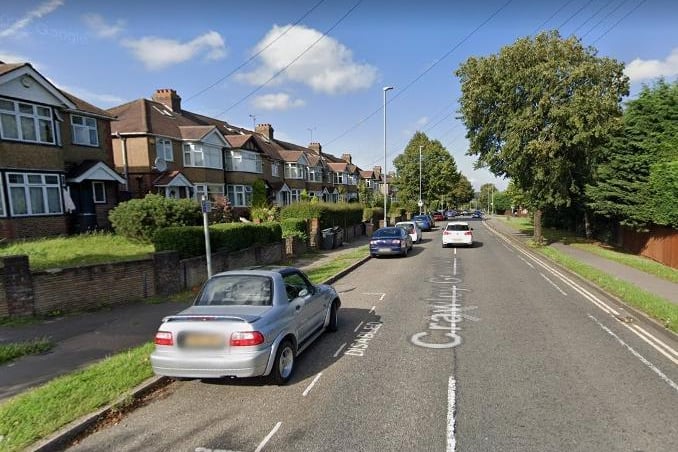
The fifth biggest price hike was in St Anns Hill where the average price rose to £273,504, up by 6.7% on the year to September 2019. Overall, 169 houses changed hands here between October 2019 and September 2020, a drop of 21% in property sales. Photo: Google
6.
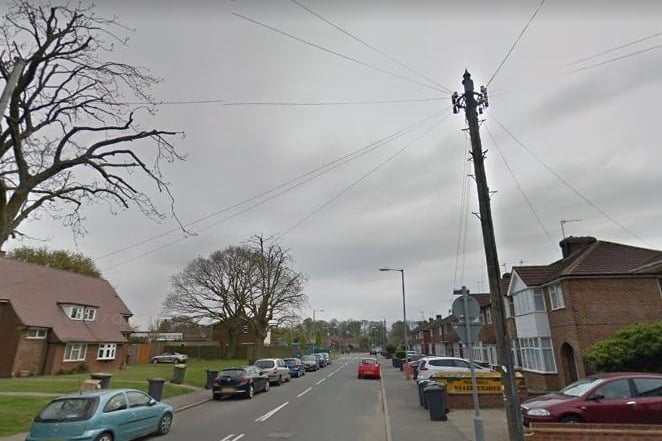
The sixth biggest price hike was in Stopsley North where the average price rose to £269,592, up by 6.6% on the year to September 2019. Overall, 92 houses changed hands here between October 2019 and September 2020, a drop of 22% in property sales. Photo: Google
7.
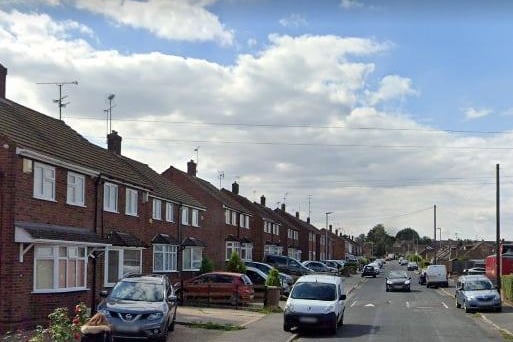
The seventh biggest price hike was in Lewsey South where the average price rose to £268,556, up by 4.6% on the year to September 2019. Overall, 63 houses changed hands here between October 2019 and September 2020, a drop of 22% in property sales. Photo: Google
8.
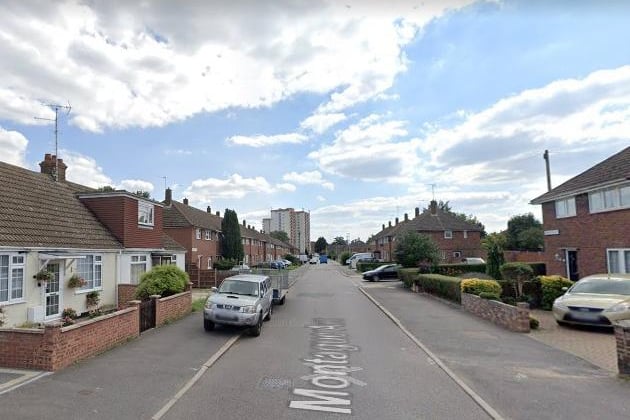
The eighth biggest price hike was in Leagrave where the average price rose to £249,086, up by 4.3% on the year to September 2019. Overall, 74 houses changed hands here between October 2019 and September 2020, a drop of 20% in property sales. Photo: Google